If you're looking for a strategic competitive advantage and enhanced business results, invest first in building a high trust culture and great workplace. A recent research study by Great Place to Work® (GPTW) Canada has identified highly significant relationships between trust in the workplace and key performance indicators (KPIs), including retail sales performance, customer service, employee turnover and workplace illness.
High trust cultures and great workplace drive superior business results
Correlating the results of its unique Trust Index© (TI) employee survey with KPIs at a large Canadian retailer, GPTW found profound business relationships.
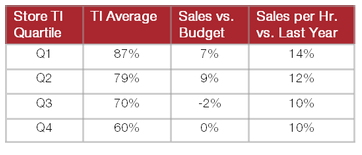
The top 25% of retail stores on the TI achieve 7 percentage basis points greater sales performance than the bottom quartile "low trust" retail stores. On $100 MM annual revenues, this translates to $7 MM greater sales.

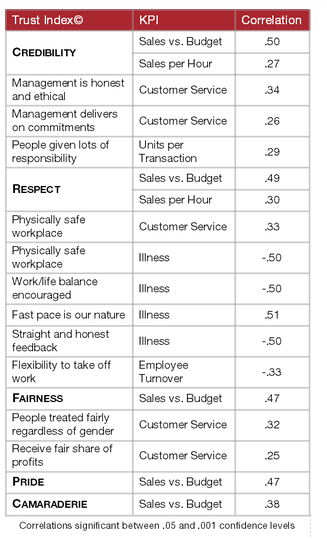
As indicated in the side panel, the research highlights numerous statistically significant correlations. For example:
- If you want to reduce employee illness, create a workplace that is not only physically safe, but which also fosters work/life balance, straight and honest feedback, and a reasonable rather than onerous work pace
- If you want to increase unit sales per transaction, develop a culture that trusts employees and delegates lots of responsibility
- And, if you want to reduce employee turnover, develop flexible work practices, e.g., support to take off work when necessary
How employees perceive and experience their corporate culture, particularly around relationships and trust, greatly influences business performance. This study provides empirical data and rich insights into which aspects of trust and underlying culture management practices drive different KPIs.
In essence, it offers retail leaders a fact-based roadmap for organizational transformation and greater business success.
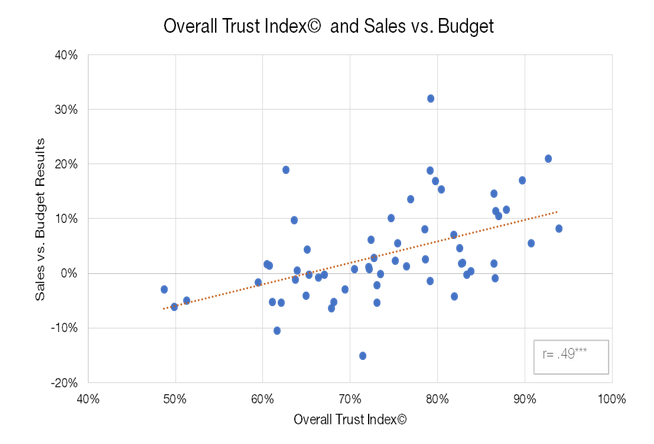
Each point on the chart represents a retail store's overall TI score and its corresponding KPI results. Notwithstanding certain "outliers", the stronger the trust levels in retail stores, the stronger their sales vs. budget. The .49 correlation between TI and this KPI is highly significant at the .001 confidence level, i.e., occurring by chance only 0.1% of the time.

 Next, we see the tangible business impact of high trust cultures. The top TI quartile (Q1) stores achieve 7% above budget annual sales vs. on budget performance for the bottom scoring TI quartile. They further achieve 14% sales productivity gains over last year vs. only 10% for the bottom quartile, low trust scores.

